View ProjeQtOr On SourceForge.net
ProjeQtOr - Project Management Tool
Support us on Capterra
OIN - Open Invention Network
ProjeQtOr free project management software - KPI Deliverable for project Report issue - ProjeQtOr


KPI Deliverable for project Report issue

More
03 Dec 2021 14:19 #1 by karl.binet
Hi,

Projeqtor Version V9.3.4

It's appears that the bottom summary in the report is not accurate, it is not showing the correct value.


Can you have a look at this issue, or maybe i'm just missing something, 

Regards 

Karl
Attachments:

Please Log in or Create an account to join the conversation.

More
03 Dec 2021 17:54 #2 by babynus
We'll have a look.

Babynus
Administrator of ProjeQtOr web site

Please Log in or Create an account to join the conversation.

More
03 Jan 2022 15:50 #3 by babynus
Hi,

Global value (%) is weighted average.
The weight is the value of the "importance".
So if all values are zero, weighted average is zero.

Babynus
Administrator of ProjeQtOr web site

Please Log in or Create an account to join the conversation.

More
20 Jan 2022 16:16 - 20 Jan 2022 16:19 #4 by karl.binet
Hi

thank you for your answer, here are my comments

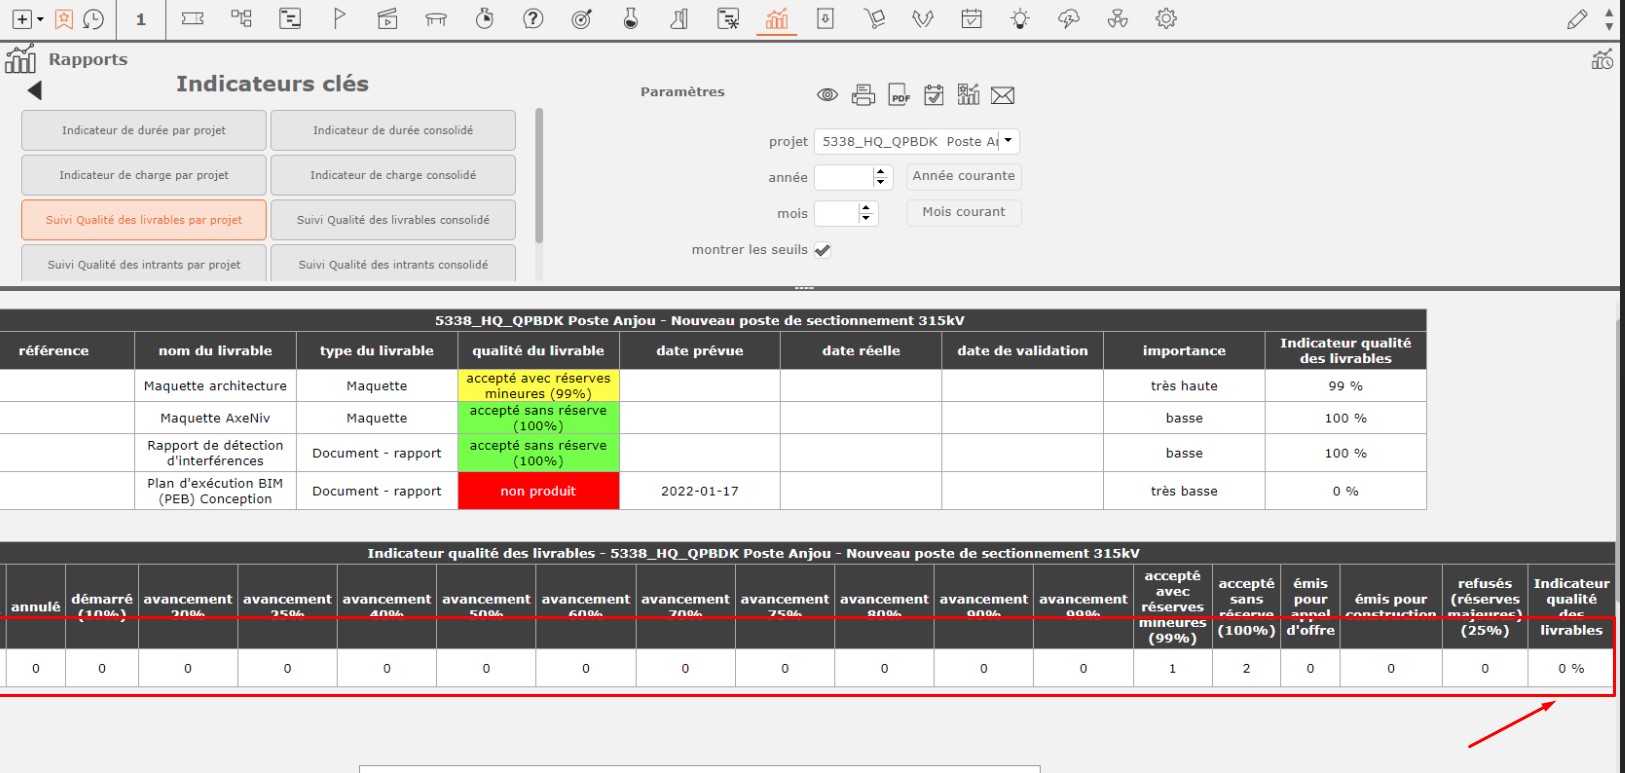
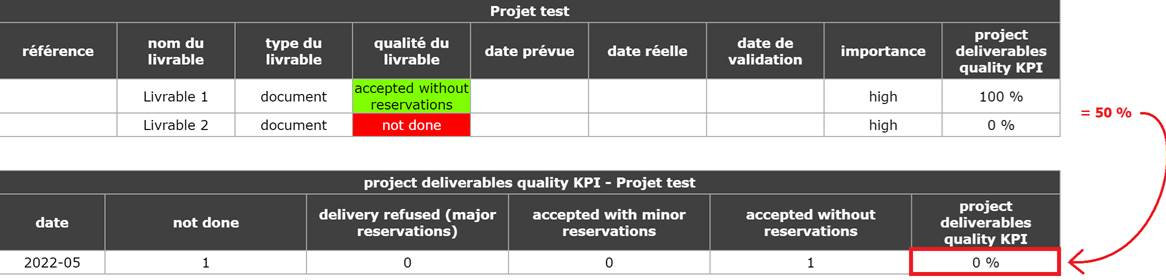
We understand well how the calculation is made, our question is more about the results that are displayed seem inconsistent with what we find in the database


So referring to the data in report/kpiDeliverable.php, we understand that the values of the tables kpiHistory and kpiValue are used.

However, these values do not seem to be in harmony
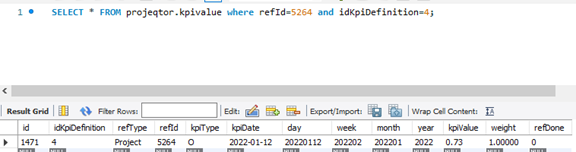
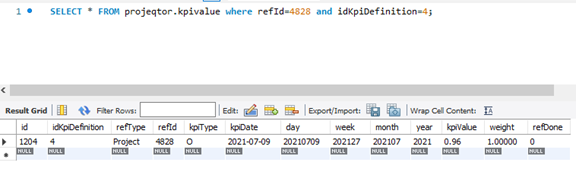
kpivalue


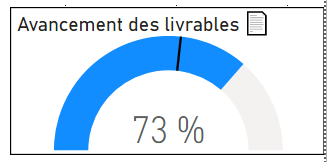
According to our calculations, the value in the database is good è 73% advancement

Our Internal Dashboard that calculates the same thing by compiling the table of deliverables :
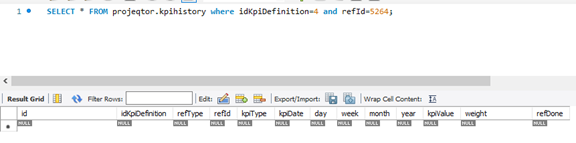
 

kpihistory
gives us no results


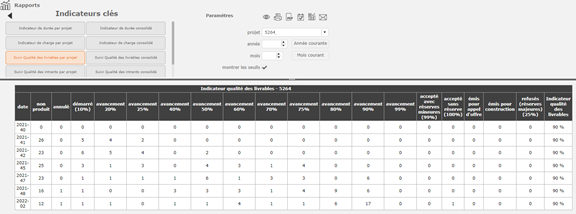
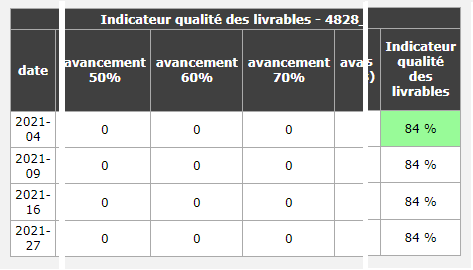
If we look at another project: 4828
Values are incomplete and incorrect  :


The value of our dashboard and the kpiValue table are good « 96% » :
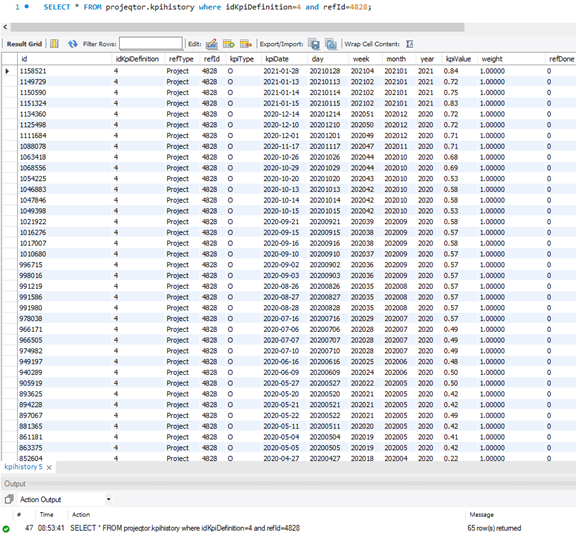
 

kpiHistory


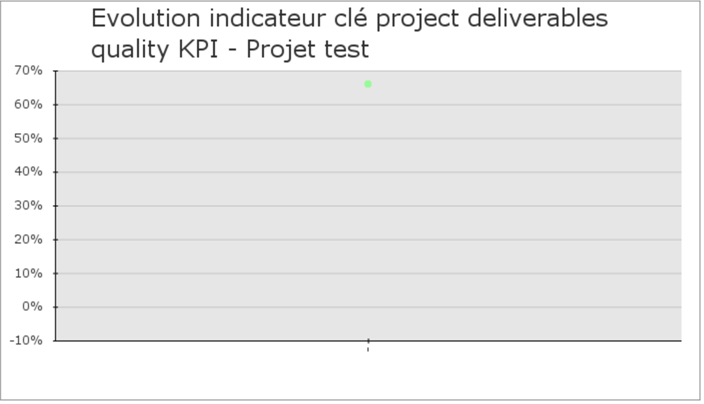
So it seems that the assembly of the summary table by weeks in the report does not show the right values, although they are compiled correctly in the database.


Attachments:
Last edit: 20 Jan 2022 16:19 by karl.binet.

Please Log in or Create an account to join the conversation.

More
25 Jan 2022 12:07 #5 by babynus
Hi,

The difference you mote mayu come from the point that the report always takes the latest value of the Kpi for a period, and not the average of all walues.

Babynus
Administrator of ProjeQtOr web site

Please Log in or Create an account to join the conversation.

More
10 Feb 2022 13:51 #6 by karl.binet
Thanks for your answer. Unfortunately, we are not averaging while doing our calculation. We have tested on a fresh install v 9.4.3. with 2 deliverables of same weight (high) : first one at 100% (completed/accepted without reservations) and the other one not done (0%).

Our understanding of the formulas is :
SUM( status(%) * weight) / SUM(weight)
So, with our example (high weight = 1 – by default) :

((100% *1) + (0% * 1)) / (1 +1) = 50% KPI
1 / 2 = 50% KPI


KPI does not seem to reflect our previous result (50%) in the table (0%) neither is the graph (near 65%)


Our question is the following:
Is our understanding of the formula and the report values wrong?
Attachments:

Please Log in or Create an account to join the conversation.

Moderators: babynusprotion
Time to create page: 0.107 seconds

Cookies settings

×

Functional Cookies

Ce site utilise des cookies pour assurer son bon fonctionnement et ne peuvent pas être désactivés de nos systèmes. Nous ne les utilisons pas à des fins publicitaires. Si ces cookies sont bloqués, certaines parties du site ne pourront pas fonctionner.

Session

Please login to see yours activities!

Other cookies

Ce site web utilise un certain nombre de cookies pour gérer, par exemple, les sessions utilisateurs.